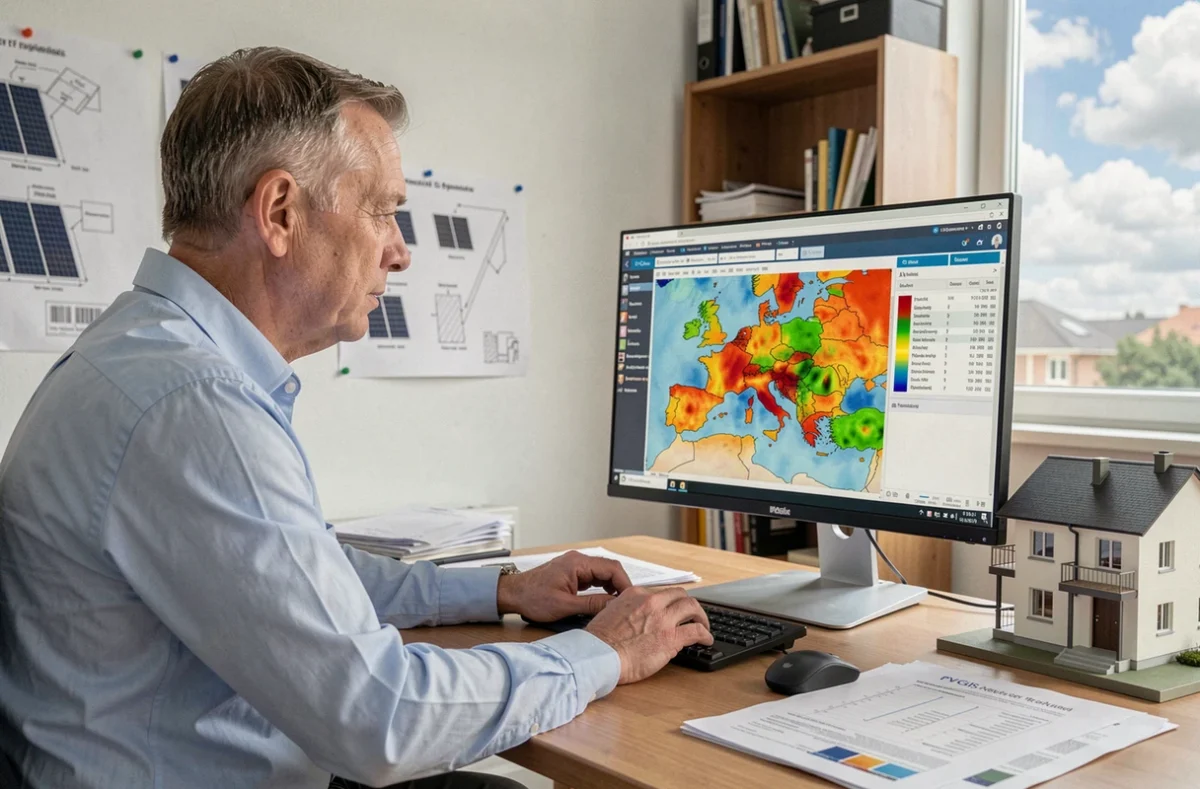
PVGIS, the free tool from the European Commission’s Joint Research Centre, provides solar irradiation estimates for any location in Europe and beyond. Its main advantage is that it combines satellite radiation data with the physical parameters of an installation (orientation, tilt and panel technology) to estimate annual output in kWh. Before installing a single panel on a roof, it’s the first tool to use to check whether a photovoltaic project is viable.
Shading, losses and consumption: what PVGIS can’t account for on its own
PVGIS calculates the solar radiation received on a tilted plane using climate averages. The simulator includes an overall system loss rate, but this rate is only a default assumption. It doesn’t account for a chimney casting a shadow over three panels in winter, or a neighbor’s tree that has grown two meters in five years.
To get a result that’s closer to reality, you need to manually adjust the “system losses” field in the interface. Actual losses often exceed PVGIS’s default assumption, especially when shading from nearby buildings, terrain or vegetation reduces the sunlight reaching certain areas at particular times of day.
One factor that’s rarely discussed is seasonal consumption patterns. PVGIS generates a month-by-month production curve, but it knows nothing about your actual energy needs. If your consumption is high in winter (electric heating, extended lighting) and low in summer, the mismatch between solar production and consumption can make a theoretical self-consumption rate look overly optimistic.
Before approving a system design, compare the PVGIS curve with your monthly consumption records. This manual comparison is still the only reliable way to size a solar photovoltaic system based on your actual usage profile.

PVGIS settings to configure for a reliable estimate
The PVGIS interface offers several input fields that directly affect the results. Some are more visible than others, and a few deserve particular attention.
Location and solar database
First, place the point on the map at the exact location of the roof, rather than simply at the center of the town. A difference of a few hundred meters can affect irradiation data, particularly in hilly or coastal areas. PVGIS offers several satellite databases depending on the geographic area. In Europe, the PVGIS-SARAH2 database covers the most recent period and offers the best spatial resolution.
Solar panel orientation and tilt
The azimuth (orientation relative to south) and tilt angle determine how much radiation the panels capture. PVGIS offers an automatic optimization feature that calculates the ideal tilt for your location. In practice, you can rarely change your roof’s pitch. Enter the actual roof pitch rather than the theoretical “optimal” angle.
A difference of a few degrees in tilt has little effect on annual output, but an east- or west-facing orientation can noticeably reduce yield compared with a due-south orientation. PVGIS lets you test several configurations and compare them.
Panel technology and system losses
The simulator asks you to select the cell type: crystalline silicon or thin film (CIS or CdTe). This choice changes the temperature coefficient used in the calculation. For the vast majority of residential installations, crystalline silicon is still the appropriate setting.
The system losses field may need adjusting. The default losses account for wiring, the inverter and soiling, but not shading. If your roof is partially shaded, increase this percentage or use PVGIS’s “horizon” feature to map the obstacle profile around the site.
- Inverter and wiring losses: the default value is suitable if the inverter is recent and the cables are short; otherwise, increase it slightly.
- Soiling and degradation: in urban or agricultural areas, dust reduces output. Allow for some additional losses.
- Shading: if obstacles block the sun at certain times, PVGIS’s horizon profile lets you account for them point by point.
- Temperature: in Mediterranean climates, panels get hotter, reducing their actual output. PVGIS calculates this automatically using weather data.
PVGIS advanced features that are often overlooked
Beyond basic estimates, PVGIS offers tools that few users take advantage of, particularly for self-consumption projects and off-grid systems.
Hourly simulation and downloadable data
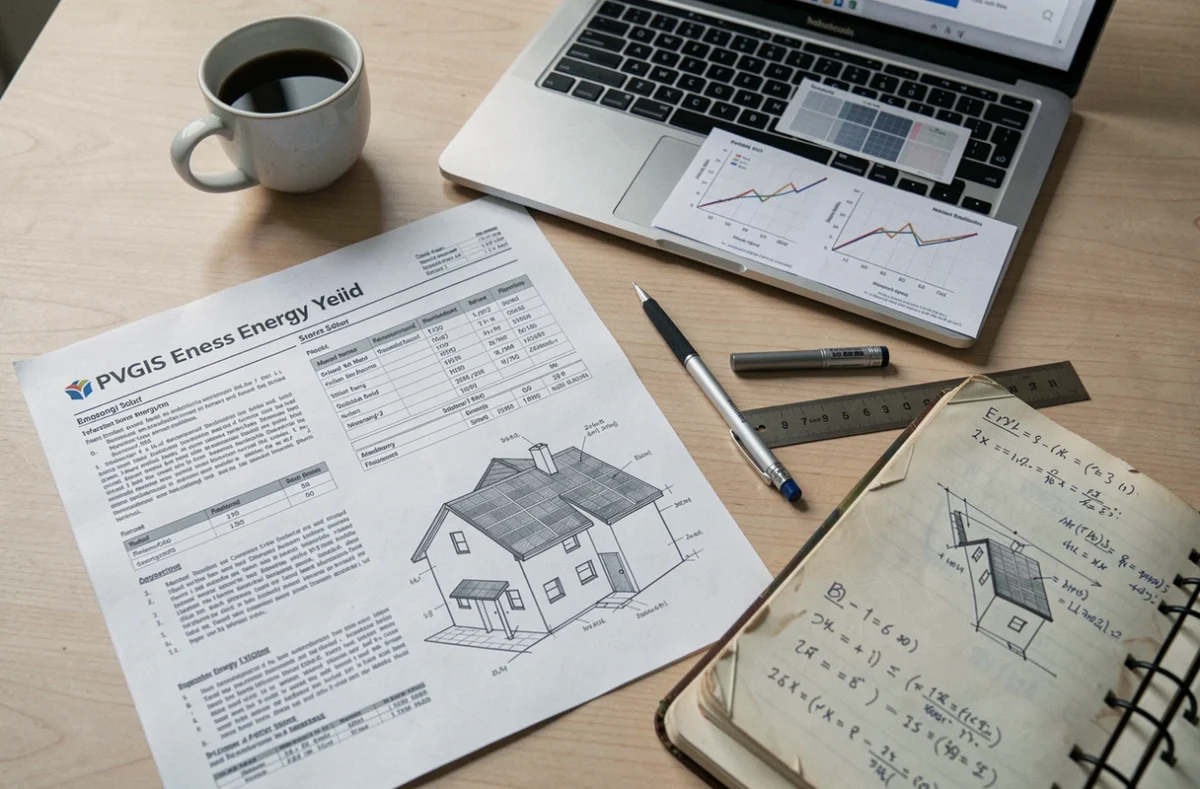
PVGIS can generate hourly production data for an entire year. This file can be exported as a CSV and used to overlay the production curve with your consumption curve (available in your energy supplier’s customer portal). This hourly comparison reveals the actual self-consumption rate, providing a much more accurate picture than a simple annual average.
Calculations for off-grid systems
For remote sites, PVGIS includes a battery sizing module. Enter your desired daily consumption and the number of days of autonomy. The simulator then estimates the required storage capacity and peak power. This feature is intended as a starting estimate, but it can quickly help define a project before you consult an installer.
Check and refine a PVGIS estimate before making a decision
PVGIS provides a solid starting point, not a quote. Several local factors are beyond the simulator’s scope and should be checked on site.
- Check actual shading at different times of day and in different seasons using a solar tracking app on your smartphone, then compare it with the PVGIS horizon profile.
- Compare estimated production with your monthly electricity bills to assess any surplus or shortfall throughout the year.
- Ask an installer to verify actual system losses after a site visit, particularly those related to wiring, the inverter and the condition of the roof.
PVGIS remains the go-to tool for free, reliable preliminary solar system sizing. Its estimates become more accurate when you adjust for losses, map the horizon profile and compare production data with your household’s consumption patterns. A simulator can’t replace an on-site assessment, but it can help you avoid choosing a system with too much or too little capacity.